The mainstream media has given the general public the false impression that the killings of police officers have grown into an “epidemic.” While the death of one innocent police officer is still one too many, these reports make it seem like violence against cops is part of a new, social trend. In actuality, the amount of violence purported against police officers waxes and wanes overtime, which follows a non-random pattern.
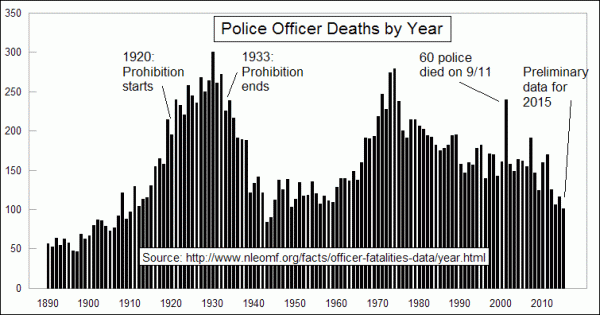
What explains this pattern? Some of the blame has to go to government prohibition. In 1920, there was a nationwide ban on the sale, production, importation and transportation of alcohol. Of course, the prohibition didn’t actually stop the consumption of alcohol. Rather, it pushed the practice underground, where organized crime and violence prevailed. Consequently, police officer deaths spiked during the prohibition and dropped when the ban ended in 1933.
Another spike in police officer deaths occurred in the early 1970s, when President Nixon declared the War on Drugs. For similar reasons during the prohibition, the War on Drugs triggered a war on cops, as reflected in graph below. The public’s denunciation of the Vietnam War and the Nixon Watergate scandal may have contributed to the death of police officers, as well.[1]

Other factors at play
While prohibition certainly played a significant role in violence against police officers, there are also several variables at work. Interestingly, neither unemployment nor inflation seems to play a significant role in the rise and fall of crime rates. For instance, the number of police officer deaths per year declined with the rest of the economy during the Great Depression in the 1930s.
In fact, the amount of police deaths per year continued to fall until the beginning of World War 2. Since 1974, there has been a steady decline in police deaths per year, as well. These figures are still too high and do not lessen the pain for anyone who has lost a loved one in the law enforcement service. Nevertheless, the graph does illustrate that a modern day epidemic of cop killings is not supported by evidence.[1]
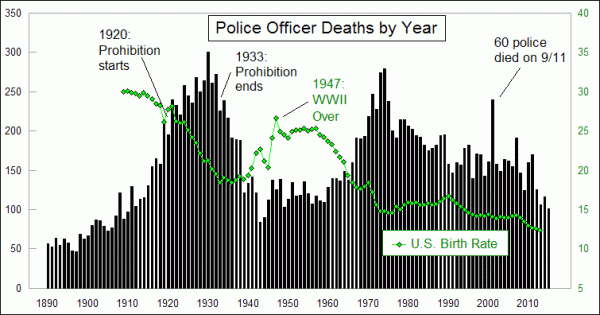
What other explanation can be given for the peaks and valleys in the history of police killings? Data provided by the Centers for Disease Control and Prevention (CDC), which documents the U.S. birth rate since 1909, may provide some answers.
The birth rate reduction hypothesis

Upon first examination of the data, there seems to be a relationship between police officer deaths and birth rates. As police deaths rise, birth rates fall; most likely a symptom of couples hesitant to raise a child in a dangerous environment. By the same token, couples are more likely to bring a child into the world if they believe conditions are safe. Nevertheless, this correlation, though it may contain an iota of truth, doesn’t always hold true in the graph.[1]
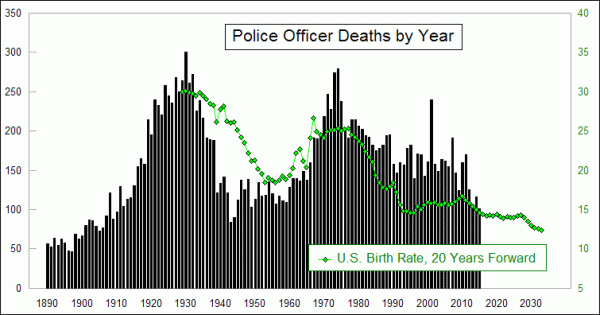
A more plausible scenario is that higher birth rates tend to result in more police officer killings twenty years later, as seen in the adjusted graph below.

This pattern makes sense from a behavioral standpoint. A twenty-year-old is far more likely to commit reckless violence against a police officer than a ten-year-old. By the time an individual reaches the age of 30 or 40, they are less likely to participate in juvenile activities that result in cop killings.[1]
Birth rates do not provide a perfect explanation for the pattern police deaths seem to follow, but it does provide some answers. The good news is that, following this logic, declining birth rates in recent years should result in a decline in police deaths within 18 years. Nevertheless, the point to be hammered is that a modern day epidemic of police shootings is a fiction, found nowhere but in the mind of the mainstream media.
Source:
[1] MCoscillator.com


